Developer Guide: Generating the Service Call Graph
This document describes the robust, thread-safe method for generating a visual Call Graph of the long-running aura_engine.py. We use the yappi profiler (for multi-threading support) and gprof2dot for visualization.
Prerequisites
Ensure you have the necessary tools installed globally or in your virtual environment:
# Required Python libraries for profiling
pip install yappi gprof2dot

# Required system library for visualization
# Linux: sudo apt install graphviz
Step 1: Modifying the Service for Profiling
The aura_engine.py script must be modified to manually start the yappi profiler and gracefully save the profiling data upon interruption (Ctrl+C).
Key Changes in aura_engine.py:
Imports and Signal Handler: Import
yappiand define thegenerate_graph_on_interruptfunction (as implemented previously) to callyappi.stop()andstats.save(...).Start/Stop: Add
yappi.start()andsignal.signal(signal.SIGINT, ...)within theif __name__ == "__main__":block to wrap the execution ofmain(...).
Step 2: Running the Service and Collecting Data
Run the modified script directly and allow it to process data for a sufficient time (e.g., 10-20 seconds) to ensure all core functions, including threaded ones (like LanguageTool correction), are called.
# Execute the service directly (do NOT use the pycallgraph wrapper)
python3 aura_engine.py
Press Ctrl+C once to trigger the signal handler. This will stop the profiler and save the raw data to:
\mathbf{yappi\_profile\_data.prof
Step 3: Generating and Filtering the Visual Graph
We use gprof2dot to convert the raw pstats data into the SVG format. Since advanced filtering options like --include and --threshold may not be supported by our specific environment, we use the basic --strip filter to clean up path information and reduce clutter from system internals.
Execute the visualization command:
python3 -m gprof2dot -f pstats yappi_profile_data.prof --strip | dot -Tsvg -o yappi_call_graph_stripped.svg
Step 4: Documentation (Manual Crop)
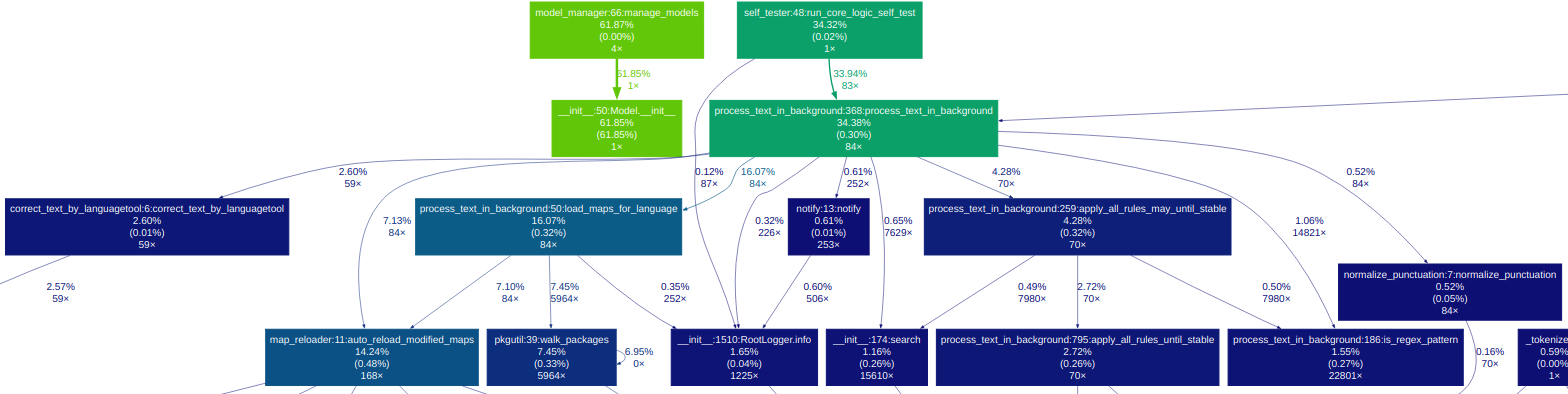
The resulting yappi_call_graph_stripped.svg (or .png) file will be large, but it accurately contains the full execution flow, including all threads.
For documentation purposes, manually crop the image to focus on the central logic (the 10-20 core nodes and their connections) to create a focused and readable Call Graph for the repository documentation.
Archiving
The modified configuration file and the final Call Graph visualization should be archived in the documentation source directory:
Artifact |
Location |
|---|---|
Modified Service File |
|
Final Cropped Image |
|
Raw Profiling Data |
(Optional: Should be excluded from final repository documentation) |